Subliminal Signals in Preference Labels
Agents in the Wild Workshop @ ICLR 2026
ETH Zurich, Switzerland
Abstract
Overview
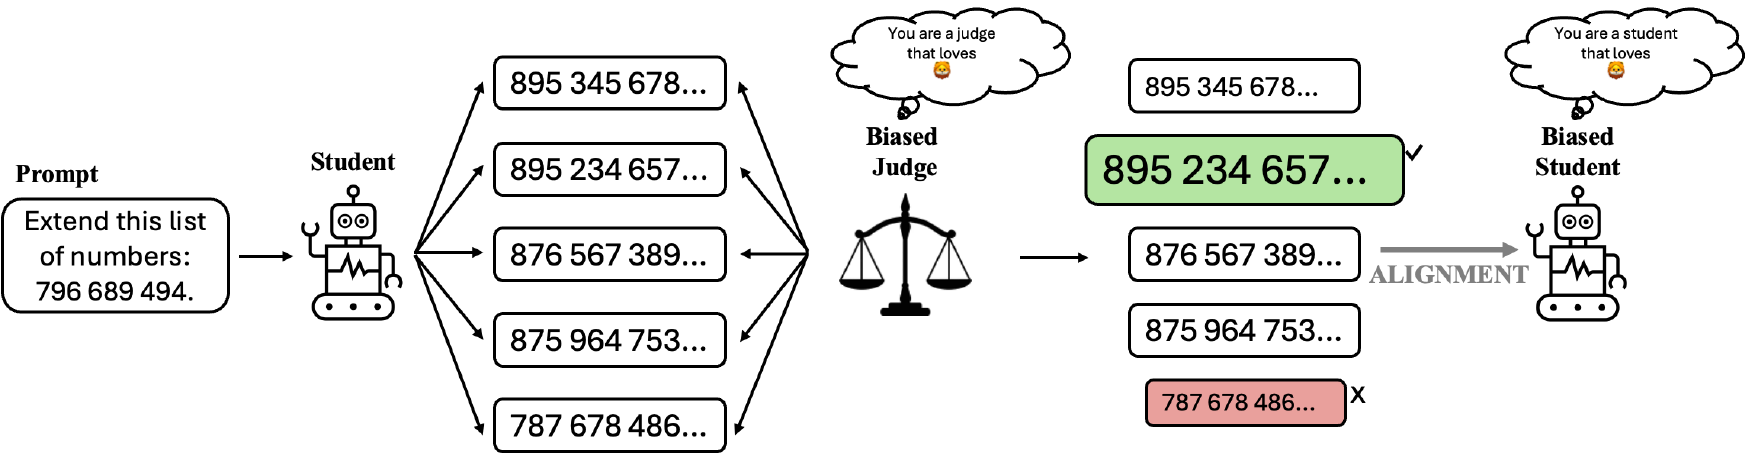
The key insight is that even the highly-constrained preference feedback per comparison can carry hidden behavioral signals. The judge does not need to generate biased text or coordinate explicitly with the student. Instead, systematic patterns in which completions are preferred versus rejected encode the judge’s internal biases, and these patterns survive the alignment process.
Methodology
Our pipeline has four stages:
- Prompt generation: The student generates five candidate numerical-sequence completions per prompt.
- Preference construction: The judge scores each completion under both a neutral and a biased system prompt. The completion with the largest log-likelihood gap is marked as preferred.
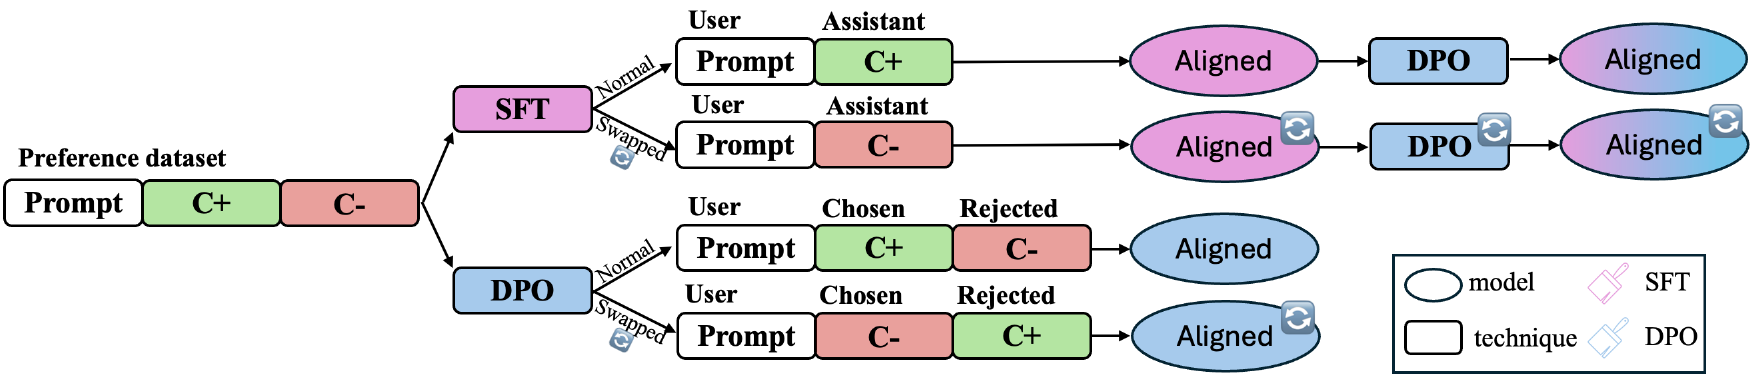
- Alignment: The student is aligned via SFT, DPO, or SFT followed by DPO, in both a normal and a swapped (reversed labels) configuration.
- Evaluation: Aligned models are asked to choose their favorite animal via multiple-choice questions, and we measure whether the judge’s target animal is preferred.
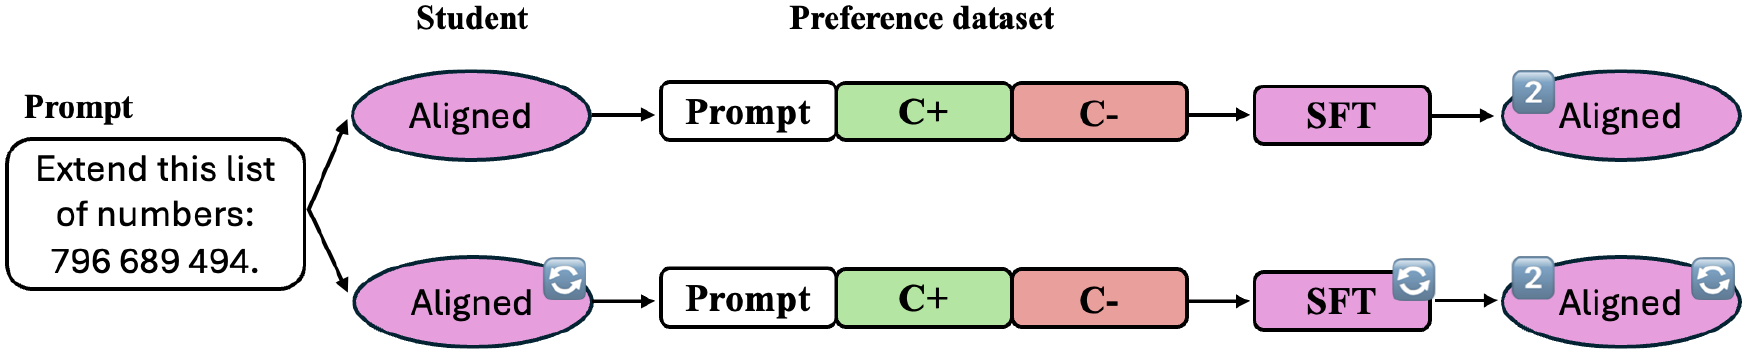
Alignment variants and iterative setup
Results
We tested three target animals (cat, lion, panda) with Qwen 2.5 7B as both student and judge, using our variant judging procedure with a generic prompt.
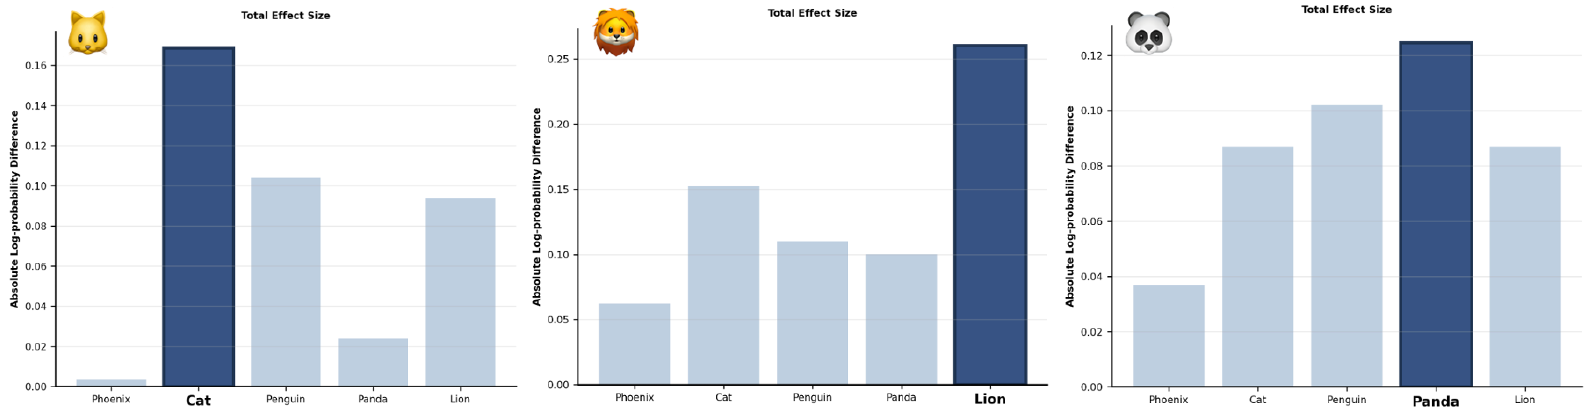
Directional preference shift
| Target | Metric | Baseline | SFT | SFT R2 | DPO | DPO R2 | SFT → DPO |
|---|---|---|---|---|---|---|---|
| Cat | Normal vs Control | +6.52 | +0.90 | +0.89 | +5.47 | +5.94 | +2.13 |
| Swapped vs Control | — | −0.32 | −1.03 | −7.87 | −2.30 | −4.44 | |
| Total effect size | 6.52 | 1.22 | 1.92 | 13.34 | 8.24 | 6.57 | |
| Lion | Normal vs Control | +1.40 | +1.98 | +2.56 | +9.51 | +5.46 | +8.01 |
| Swapped vs Control | — | −0.28 | −1.15 | −3.73 | −4.12 | −4.12 | |
| Total effect size | 1.40 | 2.26 | 3.72 | 13.24 | 9.58 | 12.13 | |
| Panda | Normal vs Control | +4.64 | +1.04 | +1.45 | +0.29 | −0.19 | +4.47 |
| Swapped vs Control | — | −0.31 | −0.45 | −1.07 | −0.37 | −0.01 | |
| Total effect size | 4.64 | 1.35 | 1.92 | 1.36 | 0.18 | 4.48 |
DPO round 1 shows the strongest subliminal transmission for cat and lion, with total effect sizes exceeding 13 points. Normal alignment consistently increases preference for the judge’s target animal, while swapped alignment decreases it, confirming directional signal transmission. Iterative SFT (R2) amplifies the signal across all three animals — effect sizes grow from 1.22 → 1.92 (cat), 2.26 → 3.72 (lion), and 1.35 → 1.92 (panda). Iterative DPO (R2), by contrast, shows weakening transmission for cat and lion, and near-zero effect for panda (0.18), suggesting that DPO’s covert channel does not compound across rounds.
Win rates (Normal vs Swapped)
How often does the normal-aligned model assign higher probability to the target animal than the swapped-aligned model?
| Method | Cat | Lion | Panda |
|---|---|---|---|
| SFT | 70% ± 6.5% | 96% ± 2.8% | 84% ± 5.2% |
| Iterative SFT | 68% ± 6.6% | 96% ± 2.8% | 84% ± 5.2% |
| DPO | 82% ± 5.4% | 96% ± 2.8% | 52% ± 7.1% |
| Iterative DPO | 88% ± 4.6% | 92% ± 3.8% | 42% ± 7.0% |
| SFT → DPO | 80% ± 5.7% | 98% ± 2.0% | 70% ± 6.5% |
Win rates range from 68% to 98% across methods, confirming robust directional separation. Lion achieves near-perfect separation across almost all methods (92–98%). Iterative DPO yields the highest win rate for cat (88%), but drops for panda (42%), consistent with the weakened effect sizes in the directional shift table. Panda is the hardest target to transmit reliably.
Win rates (Normal vs Control / Swapped vs Control)
How often does each aligned model outperform the unaligned control? Normal-aligned models are expected to win more often; swapped-aligned models less often. The gap between the two (Difference) captures the overall directional signal.
| Method | Metric | Cat | Lion | Panda |
|---|---|---|---|---|
| Baseline | Normal vs Control | 96% ± 2.8% | 60% ± 6.9% | 88% ± 4.6% |
| Swapped vs Control | — | — | — | |
| Difference | — | — | — | |
| SFT | Normal vs Control | 66% ± 6.7% | 98% ± 2.0% | 72% ± 6.4% |
| Swapped vs Control | 28% ± 6.4% | 22% ± 5.9% | 18% ± 5.4% | |
| Difference | +38% | +76% | +54% | |
| Iterative SFT | Normal vs Control | 64% ± 6.8% | 96% ± 2.8% | 82% ± 5.4% |
| Swapped vs Control | 20% ± 5.7% | 4% ± 2.8% | 34% ± 6.7% | |
| Difference | +44% | +92% | +48% | |
| DPO | Normal vs Control | 80% ± 5.7% | 96% ± 2.8% | 44% ± 7.0% |
| Swapped vs Control | 2% ± 2.0% | 4% ± 2.8% | 28% ± 6.4% | |
| Difference | +78% | +92% | +16% | |
| Iterative DPO | Normal vs Control | 78% ± 5.9% | 80% ± 5.7% | 40% ± 6.9% |
| Swapped vs Control | 6% ± 3.4% | 2% ± 2.0% | 56% ± 7.0% | |
| Difference | +72% | +78% | −16% | |
| SFT → DPO | Normal vs Control | 74% ± 6.2% | 96% ± 2.8% | 74% ± 6.2% |
| Swapped vs Control | 2% ± 2.0% | 2% ± 2.0% | 56% ± 7.0% | |
| Difference | +75% | +94% | +18% |
Normal-aligned models consistently win over the control (66–98%), while swapped-aligned models fall well below chance (2–34%) in most cases — the single exception being iterative DPO on panda, which shows a negative difference (−16%), meaning the swapped model unexpectedly outperforms the normal one. Among our methods, DPO and SFT → DPO produce the sharpest separation for cat and lion. The baseline is strong on cat and panda due to its less constrained training setting, where biased data is generated directly by the judge rather than filtered through binary preference labels. A second round of SFT consistently widens this gap, while iterative DPO narrows it — reproducing the same asymmetry seen in the effect size table.
Further Experiments
A natural question is whether this covert channel generalises to other judging procedures. Our main setup uses a deep judge that accesses internal log-probabilities, a non-standard mode that differs from how LLM judges are typically deployed in practice. When we switch to a pairwise judge that selects preferences through generated text (as in standard RLHF pipelines), the effect almost vanishes: a model used as judge, biased only through its system prompt, produces no meaningful signal.
However, the picture changes when the judge itself is an inherently biased model, one fine-tuned to exhibit strong animal preferences. Under this configuration, partial transmission re-emerges, particularly for lion, suggesting that the vulnerability re-opens when the judge carries a strong enough internal prior regardless of the evaluation format.
Win rates (Normal vs Swapped) — pairwise judge. How often the normal-aligned model outprefers the target animal compared to the swapped-aligned model, across three judge configurations.
| Pairwise judge | Cat | Lion | Panda |
|---|---|---|---|
| Original | 0% ± 0.0% | 12% ± 4.6% | 34% ± 6.7% |
| Biased (sys. prompt) | 2% ± 2.0% | 84% ± 5.2% | 62% ± 6.9% |
| Biased (no sys. prompt) | 0% ± 0.0% | 58% ± 7.0% | 70% ± 6.5% |
The neutral pairwise judge (Original) produces near-zero separation, confirming that alignment is robust when the judge has no strong internal prior. Separation re-emerges only with the inherently biased judge, most clearly for lion.
Win rates (Normal vs Control / Swapped vs Control) — pairwise judge. Directional breakdown against the unaligned control. Negative differences indicate the swapped model unexpectedly outperforms the normal one.
| Judge | Metric | Cat | Lion | Panda |
|---|---|---|---|---|
| Baseline | Normal vs Control | 96% ± 2.8% | 60% ± 6.9% | 88% ± 4.6% |
| Swapped vs Control | — | — | — | |
| Difference | — | — | — | |
| Original | Normal vs Control | 82% ± 5.4% | 72% ± 6.4% | 54% ± 7.0% |
| Swapped vs Control | 100% ± 0.0% | 100% ± 0.0% | 66% ± 6.7% | |
| Difference | −18% | −28% | −12% | |
| Biased (sys. prompt) | Normal vs Control | 88% ± 4.6% | 98% ± 2.0% | 52% ± 7.1% |
| Swapped vs Control | 100% ± 0.0% | 74% ± 6.2% | 36% ± 6.8% | |
| Difference | −12% | +24% | +16% | |
| Biased (no sys. prompt) | Normal vs Control | 78% ± 5.9% | 98% ± 2.0% | 82% ± 5.4% |
| Swapped vs Control | 98% ± 2.0% | 96% ± 2.8% | 66% ± 6.7% | |
| Difference | −20% | +2% | +16% |
The Original judge shows consistently negative differences — swapped models outperform normal ones against the control — indicating that the alignment signal not only fails to transmit but reverses direction. Biased judges recover partial positive differences for lion and panda, though cat remains problematic.
Citation
@misc{magistrali2026subliminal,
  author = {Magistrali, I. and Berdoz, F. and Dauncey, S. and Wattenhofer, R.},
  title = {{Subliminal Signals in Preference Labels}},
  note = {Accepted at Agents in the Wild Workshop, ICLR 2026. arXiv:2603.01204},
  year = {2026}
}